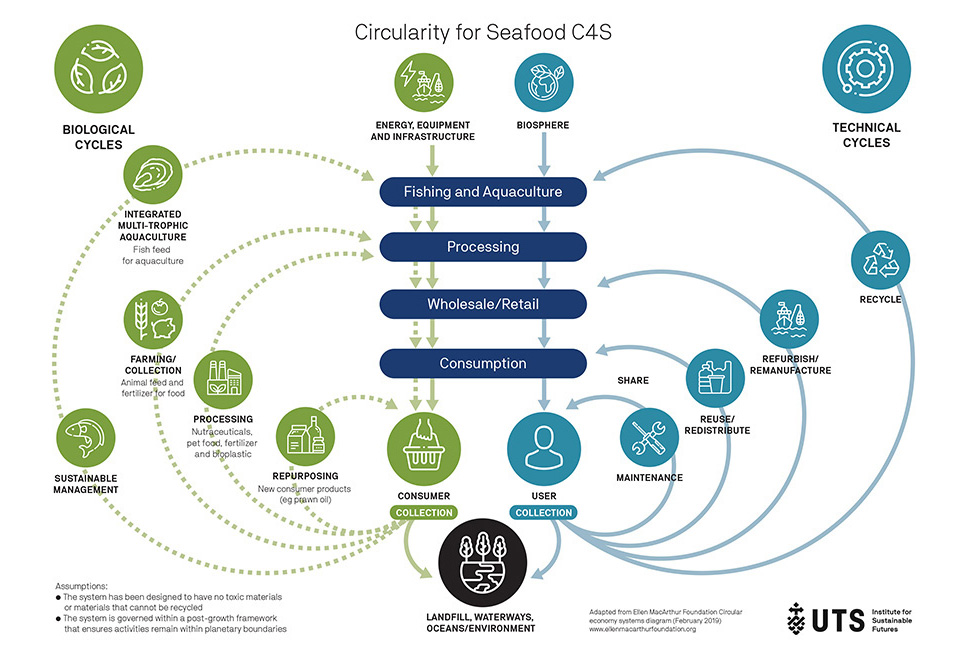
I love the mental challenge of infographics – taking something complex and making it understandable at a glance. Here’s a recent project for UTS to illustrate the outcome of research into how the Seafood industry can be made more sustainable through circular economies.